Analytics and forecasts
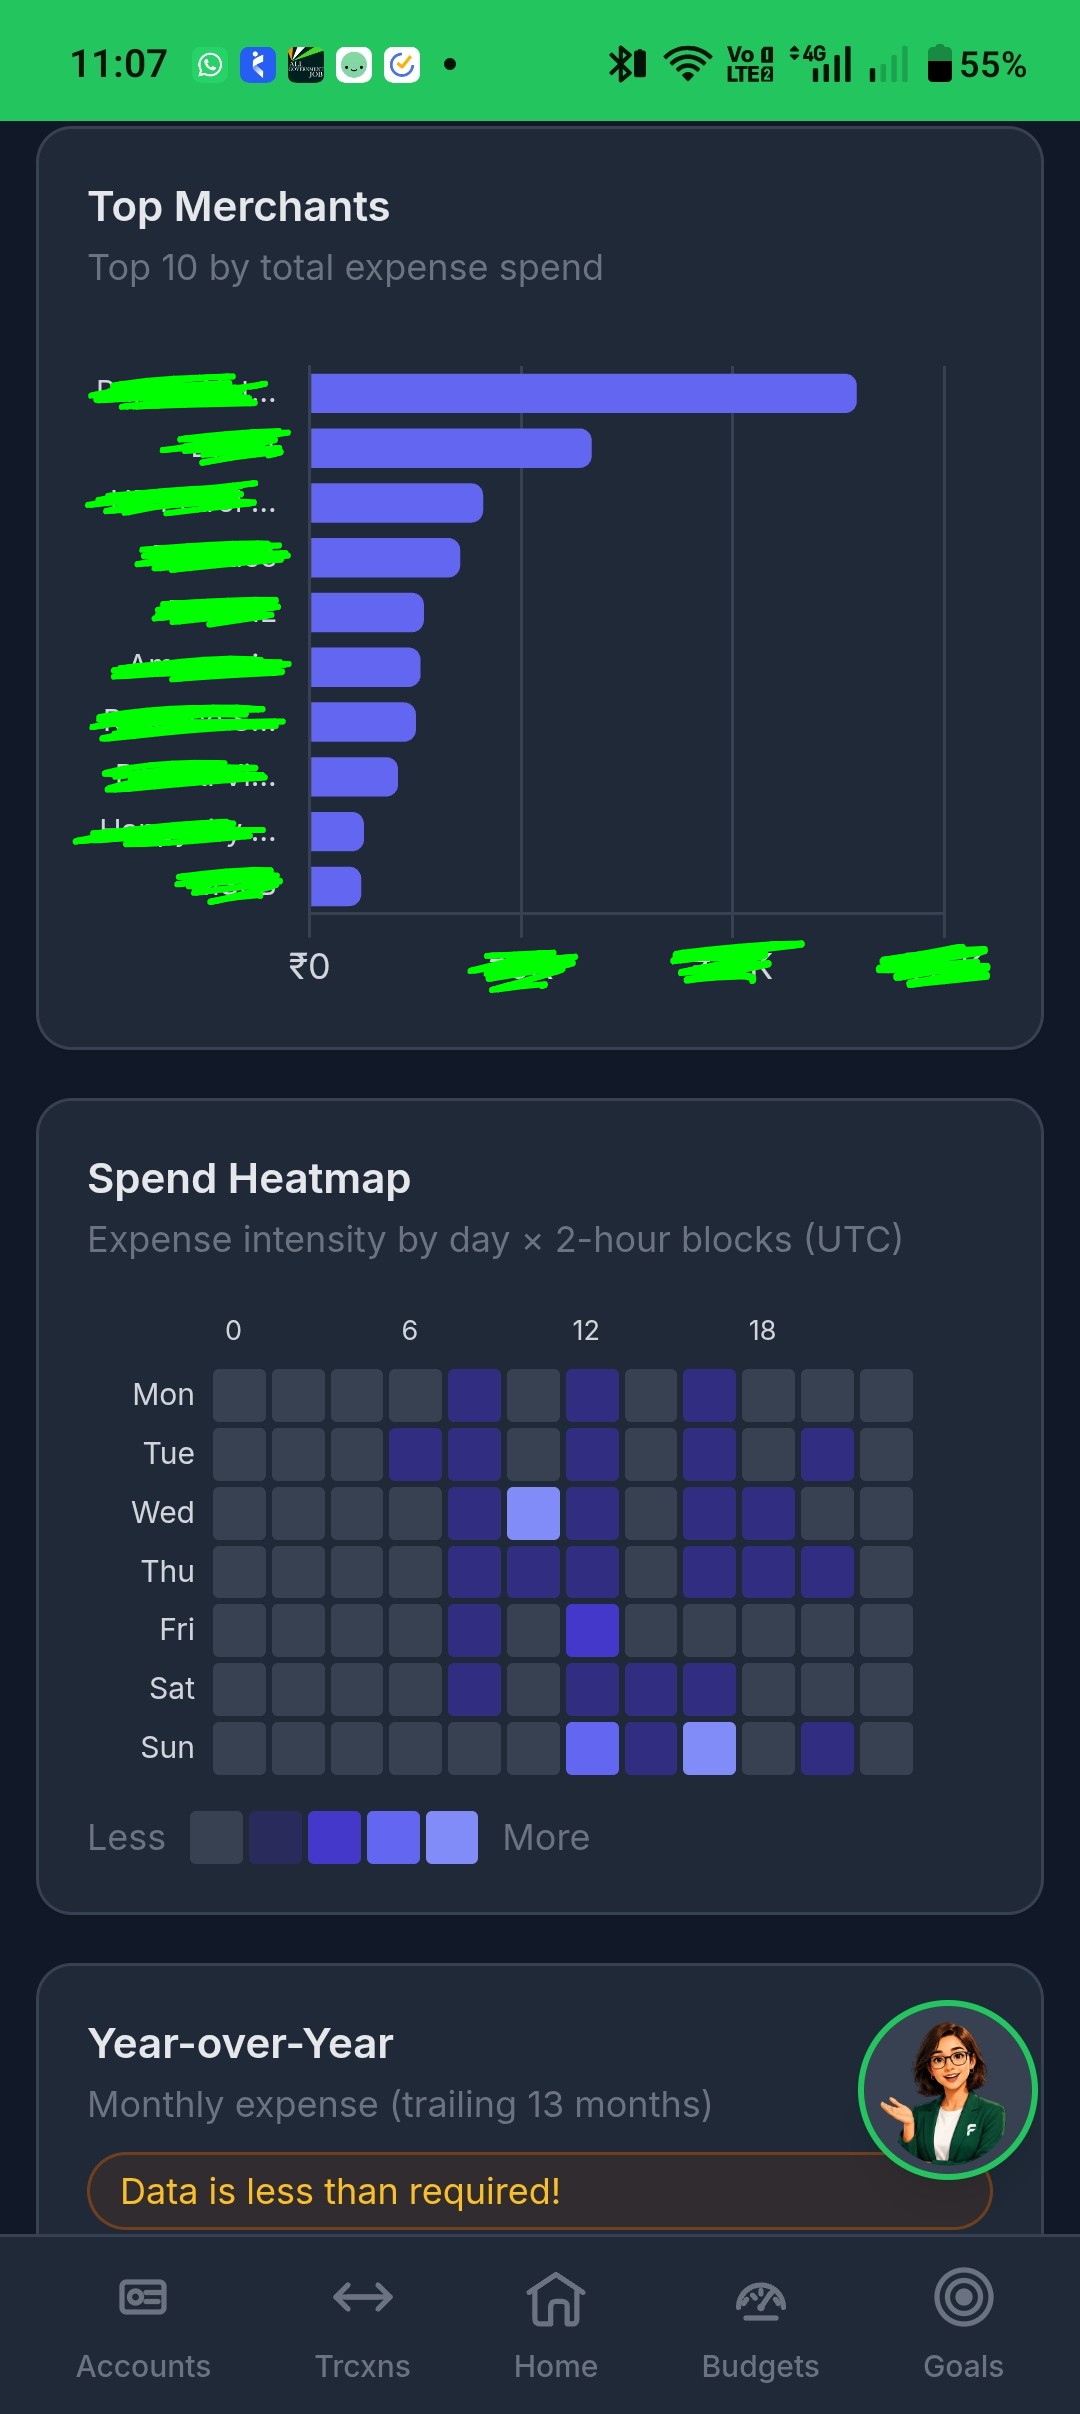
Charts for income vs expense, categories, merchants — plus cashflow that looks ahead, not just back.
Written by Sumiet · Updated
Home is the snapshot. Analytics is the zoom.
- From Home, open Analytics (or sidebar on the desktop).
- Pick a period.
- Read income vs expense, category mix, merchant hits.
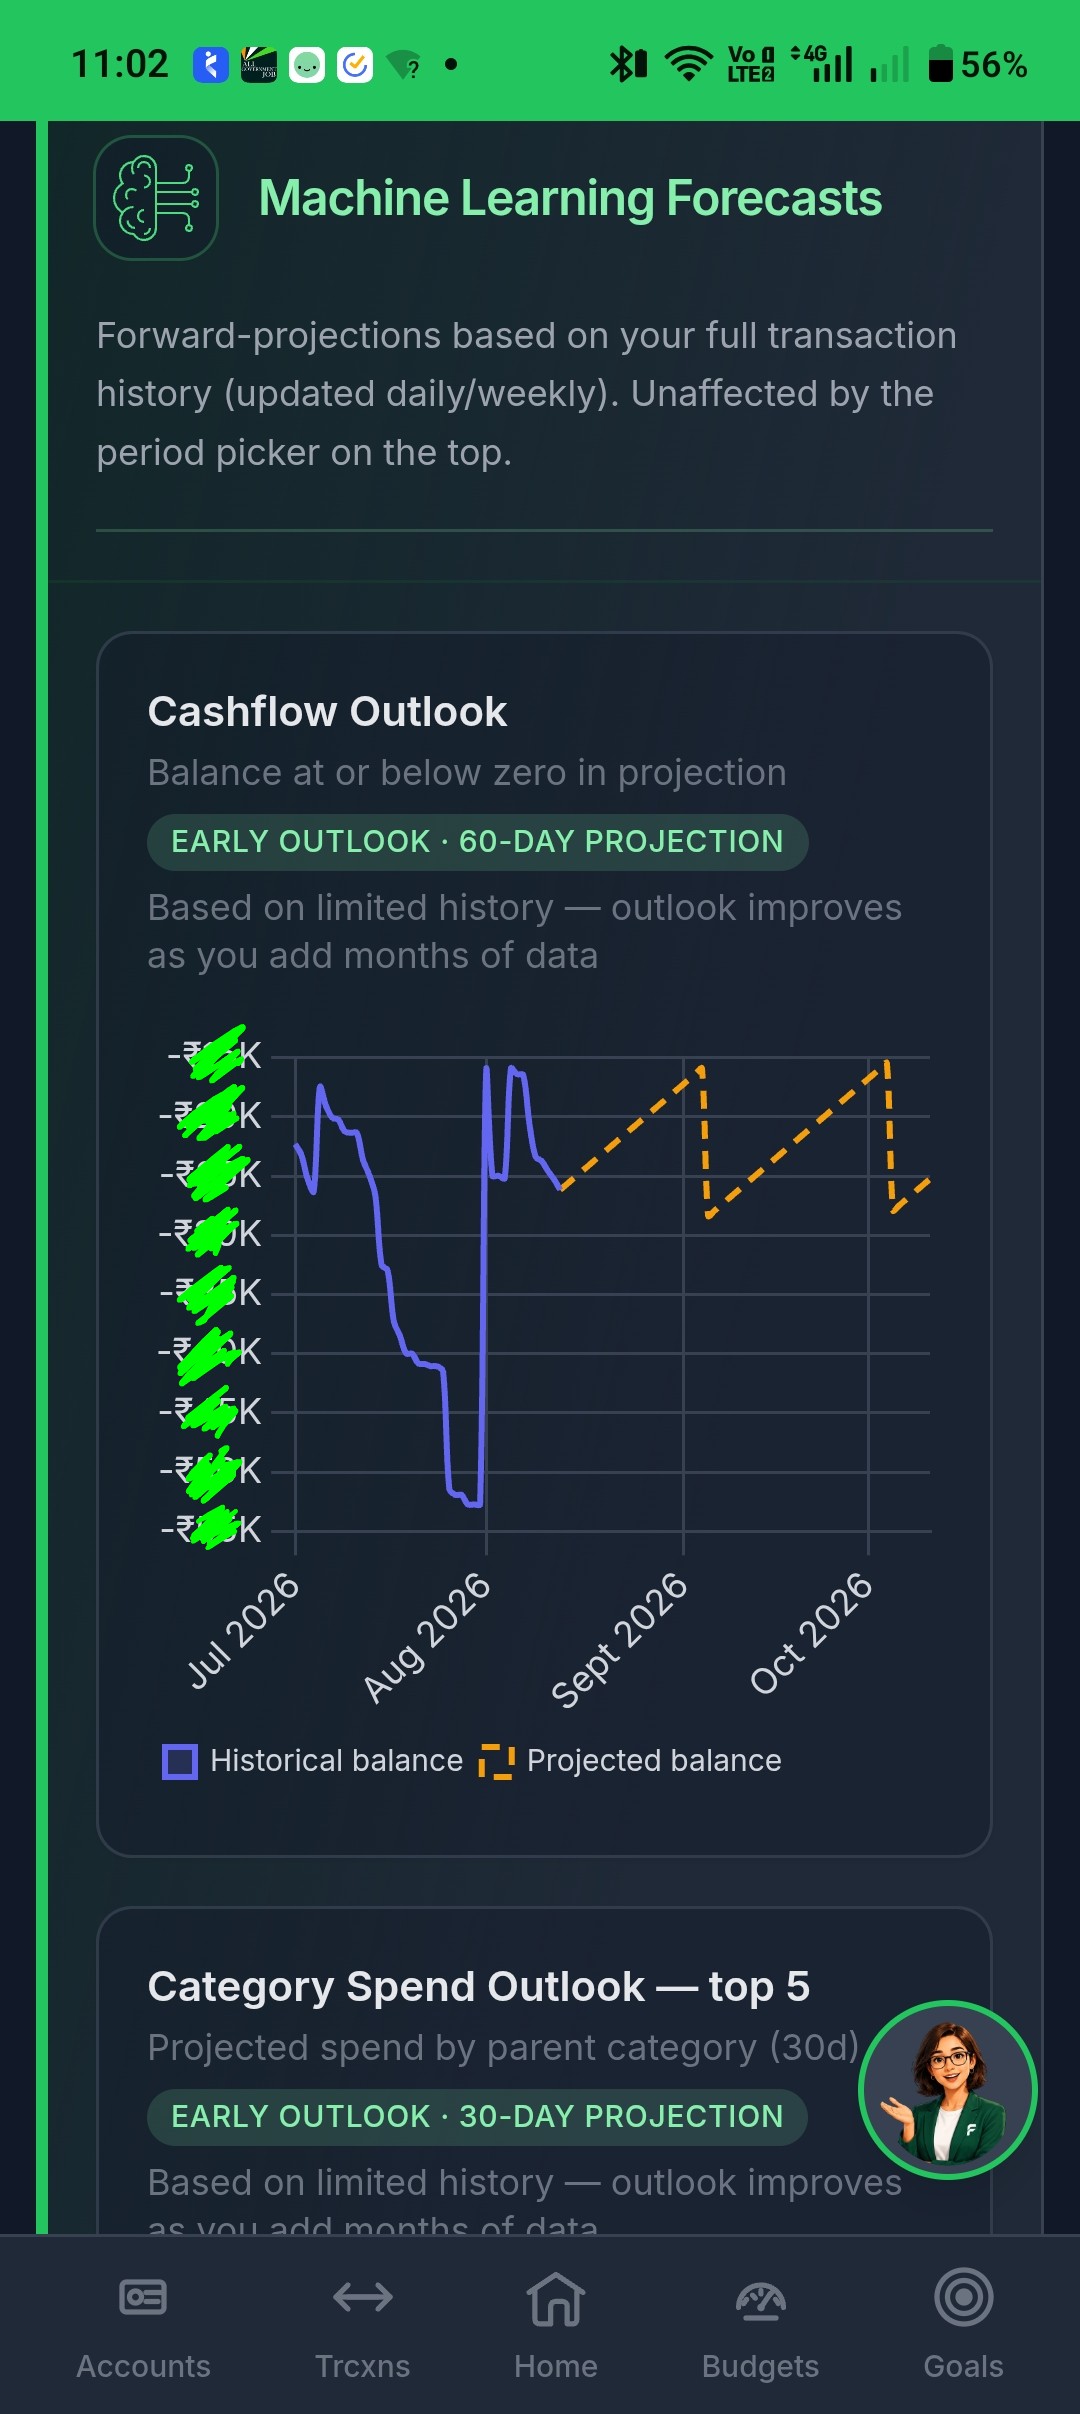
- Check machine learnt cashflow / forecast views when you have enough history.
Forecasts get smarter with more months — and with recurring salary, rent, and EMIs on file. See Recurring transactions.
💡 Philosophy of expenseOS: Garbage in, garbage out — see Accurate logging.
App Screenshot